Founding Academic Program — early external-lab evaluation pricing is now available. View pricing
Product overview

A visual operating layer for the complete experiment.

Instraxis Control brings sequence design, environment control, external instruments, live figures and data logging into one Windows application. It is intended for researchers who need a finished workflow rather than another software framework to develop.
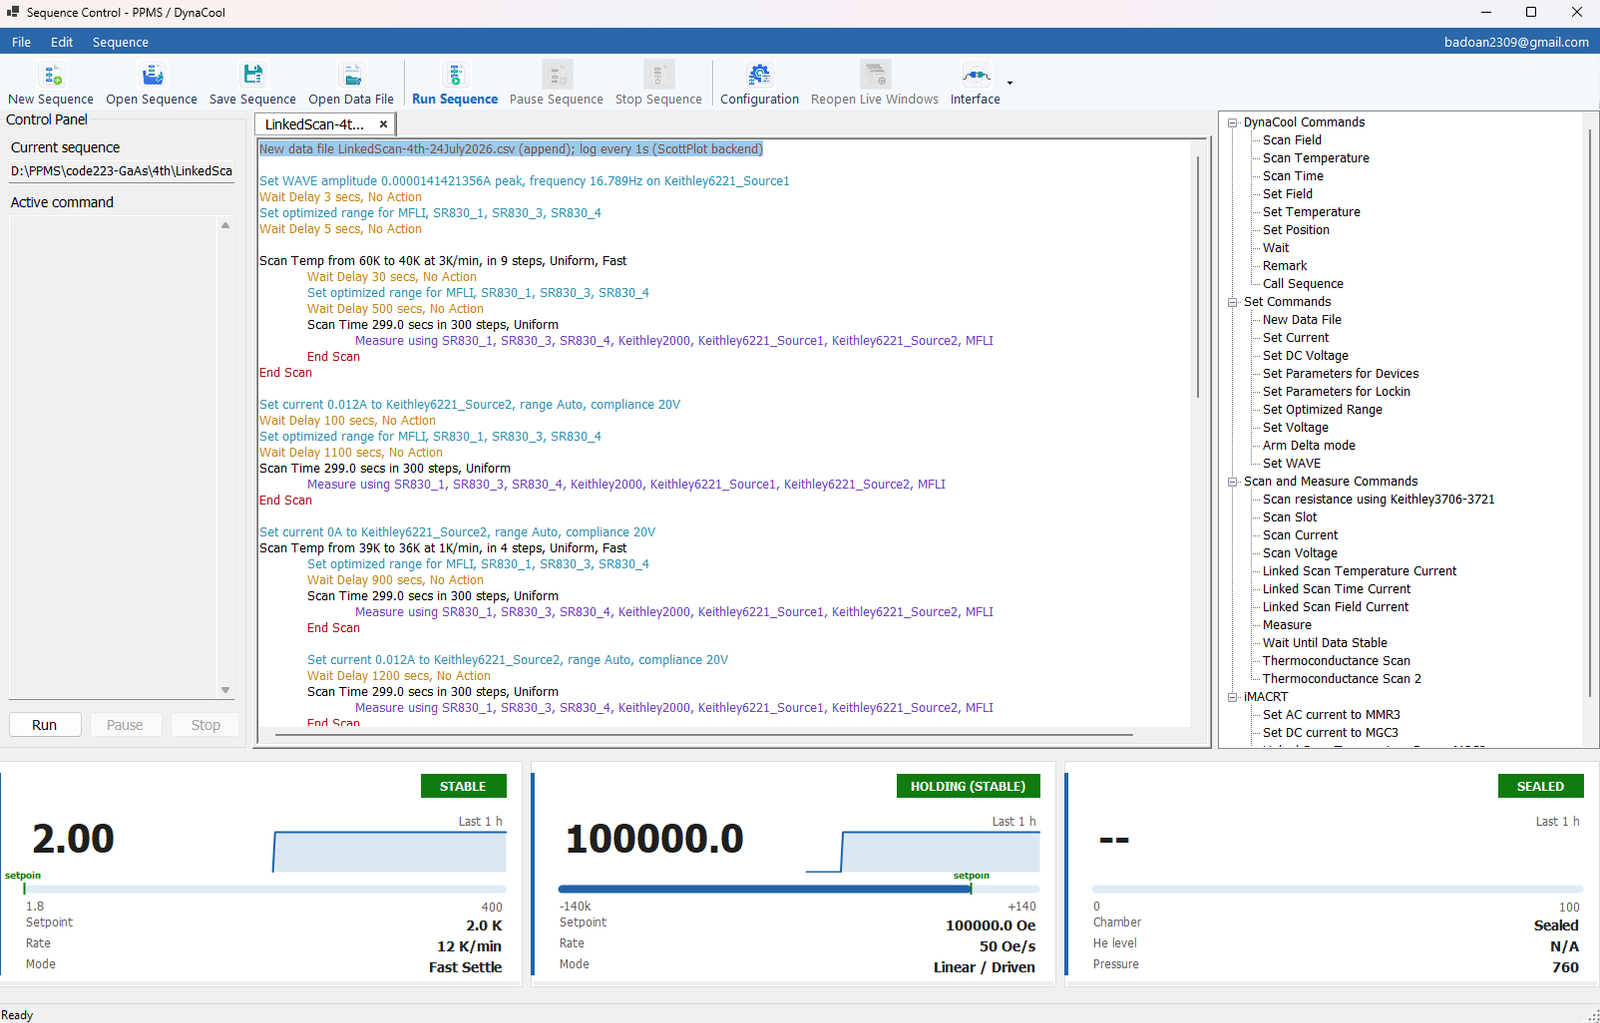
Instraxis Control sequence editor
Actual application interface. The center is the experiment script; the right is the command catalog; the bottom is the live environment state.
Sequence-centered operation

The experiment remains readable.

Instraxis keeps complex measurement logic visible as an operator-readable sequence. Users do not need to inspect an instrument driver or a graph of programming blocks to understand what the experiment will do next.

  • Insert from the command catalogChoose a command, configure it in a dialog and place it into the sequence.
  • Edit the existing commandDouble-click later to reopen the stored parameters and modify them.
  • Build large workflowsUse scans, linked scans, waits, measure blocks, comments and called sequences.
Product pillars

The functions that turn control code into a usable product

Instraxis combines several layers that laboratories normally have to assemble and maintain themselves.

Guided command dialogs

Device and workflow parameters are entered through dedicated interfaces and stored with the command.

Environment-aware sequences

Temperature, field, chamber and stability steps live beside the external measurement logic.

Multi-device orchestration

Coordinate several sources, meters and lock-ins inside the same experiment.

Live data and files

Keep the data table, live figures and output file connected to the running sequence.

Detailed capabilities

A product surface made for laboratory operation

The exact device and command list can grow, while the operator model remains stable.

Sequence editor

Readable command text, nested scan blocks and a clear active-command area.

  • Save / open sequence files
  • Copy, paste, comment and reorder
  • Call reusable sequence files
  • Run, pause and stop controls

Environment dashboards

Immediate visibility into the state of the base system.

  • Temperature and setpoint
  • Magnetic field and sweep rate
  • Chamber status
  • Trend and status indicators

Live figures

Follow multichannel data as it is acquired.

  • Multiple Y axes
  • Channel selection
  • Data grid below the chart
  • Reopen live windows during a run

Practical execution logic

Experiment behavior is encoded as explicit steps rather than hidden in ad hoc code.
  • Wait and stabilization steps
  • Linked scans
  • Range and parameter commands
  • Long-duration operation focus
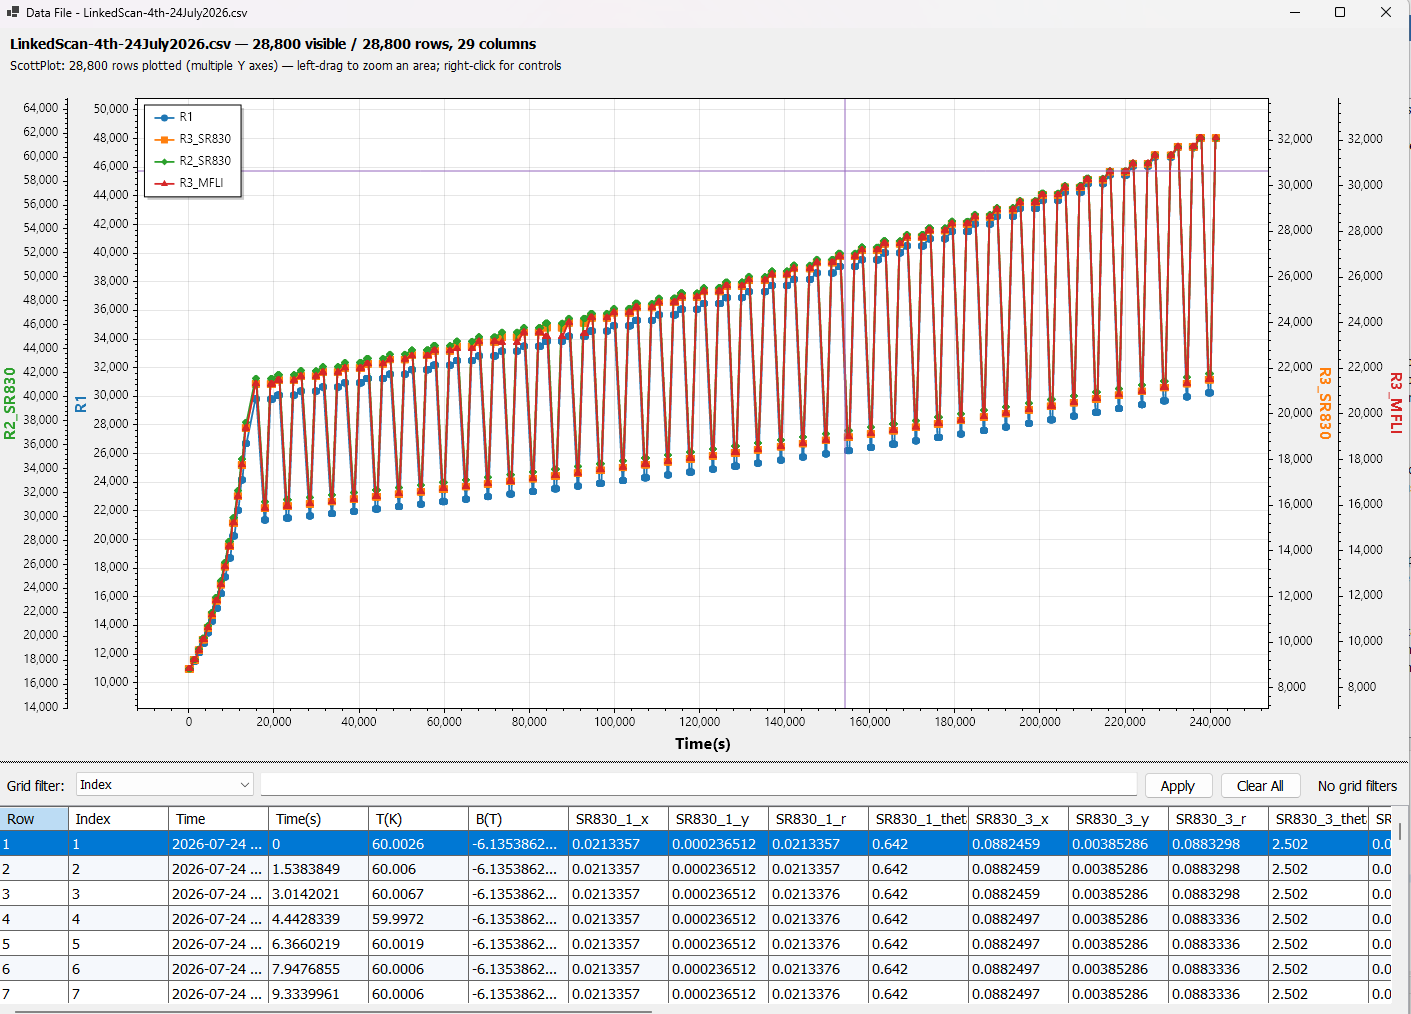
Instraxis live figure
Actual measured data. Multichannel plotting and data rows generated during a real linked-scan campaign.
Live measurement feedback

Keep the data visible while the sequence continues.

For an experiment that lasts many hours, the user must be able to confirm that channels are responding, values are evolving correctly and data is still being recorded. Instraxis treats the live figure as part of the product workflow.

  • Multiple channelsCompare readout devices in the same view.
  • Multiple Y axesPreserve visibility when signals have different ranges.
  • Data tableInspect individual rows below the chart.

Evaluate the workflow on the hardware you already own.

The first evaluation should use a real sequence from your laboratory, not a generic software demo.